
technicals
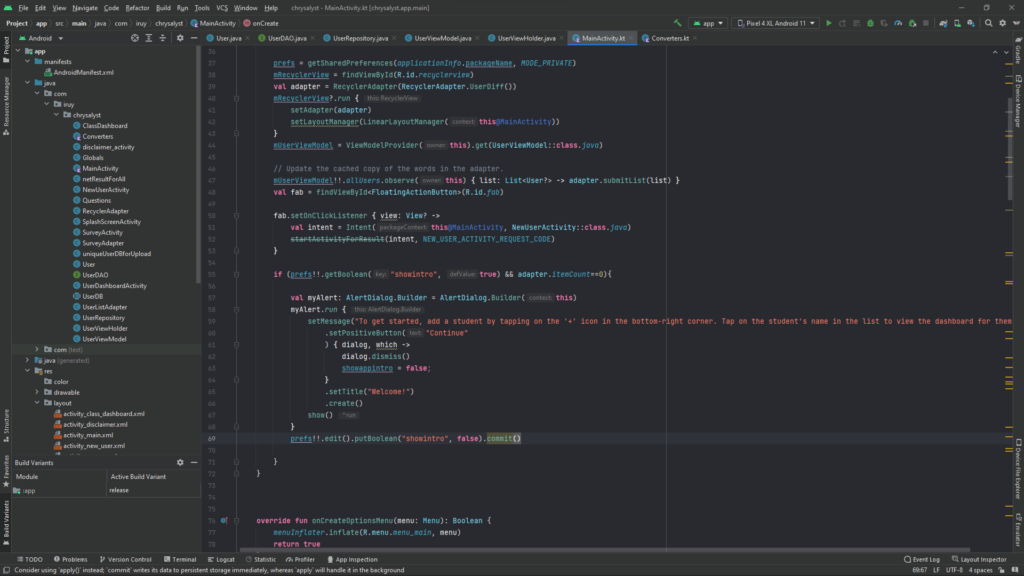
The chrysalyst codebase spans 3,854 lines of code written across 2 languages, Java and Kotlin, with UI and markup in XML. Android Studio 2021.2.1 was the IDE used to develop chrysalyst, and debugging was done on a virtual device (a Pixel 4A running Android 11) as well as a physical device (a Samsung Galaxy A52 running Android 12).
The source code contains 21 Java classes, 2 Kotlin classes, and 33 XML files. Only one third party library was used—PhilJay’s MPAndroidChart for the graphing functionality, apart from which only stock Google/ AndroidX libraries were used.
The application is structured around an SQLite database created and managed via the Room API. This database contains the list of students in a class and stores the teacher’s responses to the 17 questions in an ArrayList to maintain a chronological record. The database also contains information such as the last date on which the teacher responded for a particular student, the number of times the teacher has responded for that student, and a list of the category scores by time.
Since the database object contains complex types (like List<String>), a converter class had to be written to parse it in and out of the SQLite database. This was written in Kotlin and used Google’s GSON library along with iterative logic to do the same.
To expose the methods already provided by Room and perform database queries, a Data Access Object (DAO) interface was written in accordance with Google’s guidelines. The custom method headers included here were defined in a repository class, which stored a LiveData<List<>> of all database members for dynamic access and mutation throughout the application lifecycle. The methods written included ones to delete an individual from the database, delete all individuals, get a list of all the individuals for display in the UI, update the information associated with one individual in the database, retrieve an individual’s information based on a unique identifying number, and to verify the identity of an individual from the database basis the unique number.
The repository was further abstracted through a ViewModel, which was used by all the UI threads to interact with the database. In addition, the ViewModel contains scoring logic used to calculate the category score values based on the responses of a teacher for a particular student, as well as logic to average the scores across the entire class for the class dashboard.
The above was the core around which the rest of the application was built. All the remaining classes are either activities or fragments meant to expose functionality to the user. The activities perform either data collection or data output operations for the teacher.
The main activity displays a RecyclerView of all the students inputted by the teacher. The teacher can add a student by tapping on the round ‘+’ button in the bottom right and is taken to a new activity where they are expected to enter the student’s name and a unique identifying number. Failing to do so generates a Toast prompt asking the teacher to fill in this information accordingly.
The teacher can tap on the name of a student in the RecyclerView (this was implemented via a custom OnClickListener) and is taken to a Student Dashboard displaying the results from past responses and enabling them to respond again (or for the first time) by tapping on a button. This takes them to a new activity where they can fill in answers to the 17 questions by tapping on radio buttons. All questions are compulsory and failing to answer a question leads to a prompt with the number(s) of the question(s) missed out displayed.
The Student Dashboard contains 5 graphs- one bar chart and 4 line charts. The bar chart displays the category scores of the most recent response for that student, while the line charts provide the trendlines for the category scores, displaying at maximum the past 5 response values. Below the bar chart and before the line charts, the dashboard provides a recommendation to the teacher for that particular student based on the most recent response. Beside the title of each chart, additional information is available by tapping on the ‘i’ icon, which displays a popup containing an explanation of that parameter to help the teacher interpret the values.
A similar class dashboard is available by opening the menu in the upper right corner and tapping ‘Class Dashboard’. This provides only a bar chart depicting the average of the most recent response for all students. If the teacher hasn’t answered for even one student, the class dashboard is unavailable to ensure consistency in ratings from the teacher’s side.
Other miscellaneous activities include the disclaimer activity, showing the disclaimer of the application on a user’s first run, and the splash screen activity.
Common UI elements used in this application include the RecyclerView, TextView, Button, FloatingActionButton, RadioButton, LineChart and BarChart.
In the future, integration with a school’s dedicated servers for an offsite centralized backup of the database can be easily added if so desired. Similarly, so can an option to import a list of students and their unique identifiers into blank new database entries. Since the application uses a dynamic question and scoring structure, questions can be added/ modified without much additional development.
For future editions of the app, a tour functionality to guide the teacher through the usage of the application, as well as a notification reminder functionality to ensure that they periodically and uniformly answer for all their students based on the frequency of their choice will be added.